- 2025-02-03T00:00:00
- Company Research
PLX reported Q4 2024 revenue of VND71tn (+3% YoY), reported NPAT-MI of VND546bn (-15% YoY), and recurring NPAT-MI of VND415bn (-31% YoY). Revenue growth was driven by a 4.8% YoY increase in sales volume, which outweighed the YoY lower average selling price following an 11% YoY decline in Brent oil prices. Gross profit grew 16% YoY, supported by higher regulated operating costs for gasoline and diesel, which rose by VND60/liter (+6%) and VND140/liter (+14%), respectively, in July 2024. However, NPAT-MI declined due to (1) an 18% YoY increase in SG&A expenses, driven by a 22% YoY rise in outsourcing and other cash costs, and (2) an 83% YoY drop in net financial income, mainly due to a net FX loss of VND122bn (compared to a net FX gain of VND138bn in Q4 2023).
For full-year 2024, PLX achieved revenue of VND284tn (+4% YoY) and NPAT-MI of VND2.9tn (+2% YoY). Excluding one-off income from the PG Bank divestment, recurring NPAT-MI reached VND2.7tn (+17% YoY). This growth was driven by (1) a 2.0% YoY increase in sales volume and (2) a 0.5-ppts expansion in GPM, supported by higher regulated operating costs. These outweighed a 12% YoY increase in SG&A expenses and an 18% YoY drop in profits from joint ventures and associates.
PLX’s full-year revenue, reported NPAT-MI, and recurring NPAT-MI completed 102%, 94%, and 81% of our forecasts, respectively. However, we foresee downside risk to our 2025 earnings forecast, pending further review. This is primarily due to (1) lower-than-expected sales volume and GPM, (2) higher-than-expected SG&A expenses, and (3) a delay in our assumption for a one-off loss of VND300bn from the Petrolimex Laos divestment, which was not completed in 2024 and may shift to 2025.
Figure 1: PLX’s 2024 results
VND bn | Q4 2023 | Q4 2024 | YoY | 2023 | 2024 | YoY | % of Vietcap’s 2024F |
Brent oil price (USD/bbl) * | 83 | 74 | -11% | 82 | 80 | -3% | 100% |
Gasoline price (VND/liter) * | 21,997 | 19,663 | -11% | 21,995 | 21,373 | -3% | 113% |
Diesel price (VND/liter) * | 21,190 | 18,374 | -13% | 20,526 | 19,602 | -4% | 105% |
Domestic sales volume (mn m3) | 2.57 | 2.69 | 4.8% | 10.32 | 10.52 | 2.0% | 98% |
Revenue | 68,656 | 71,038 | 3% | 273,979 | 284,028 | 4% | 102% |
Gross profit | 3,982 | 4,604 | 16% | 15,264 | 17,315 | 13% | 98% |
Selling expense | -3,252 | -3,894 | 20% | -12,140 | -13,531 | 11% | 102% |
G&A expense | -299 | -282 | -6% | -949 | -1,037 | 9% | 102% |
Operating profit | 431 | 428 | -1% | 2,175 | 2,748 | 26% | 83% |
Financial income | 606 | 295 | -51% | 2,743 | 1,635 | -40% | 86% |
Financial expenses | -357 | -251 | -30% | -1,723 | -1,193 | -31% | 93% |
Interest expenses | -214 | -61 | -71% | -899 | -569 | -37% | 72% |
Profit/(loss) from JVs, associates | 119 | 125 | 6% | 624 | 511 | -18% | 101% |
PBT | 849 | 760 | -10% | 3,947 | 3,960 | 0% | 93% |
Income tax | -86 | -148 | 73% | -880 | -797 | -9% | 93% |
Reported NPAT-MI | 641 | 546 | -15% | 2,827 | 2,890 | 2% | 94% |
Recurring NPAT-MI | 600 | 415 | -31% | 2,300 | 2,683 | 17% | 81% |
|
|
| Δ ppts |
|
| Δ ppts |
|
Gross profit margin % | 5.8% | 6.5% | +0.7 | 5.6% | 6.1% | +0.5 |
|
Sales & marketing % sales | 4.7% | 5.5% | +0.7 | 4.4% | 4.8% | +0.3 |
|
General admin % sales | 0.4% | 0.4% | -0.0 | 0.3% | 0.4% | +0.0 |
|
EBIT Margin | 0.6% | 0.6% | -0.0 | 0.8% | 1.0% | +0.2 |
|
NPAT-MI margin | 0.9% | 0.8% | -0.2 | 1.0% | 1.0% | -0.0 |
|
Core NPAT-MI margin | 0.9% | 0.8% | -0.1 | 0.8% | 1.0% | +0.2 |
|
Source: PLX, Vietcap (*average prices)
Figure 2: Platts Singapore price movement (reference point for Vietnamese petroleum retail prices), excluding the impact of the petroleum stabilization fund (USD/bbl)
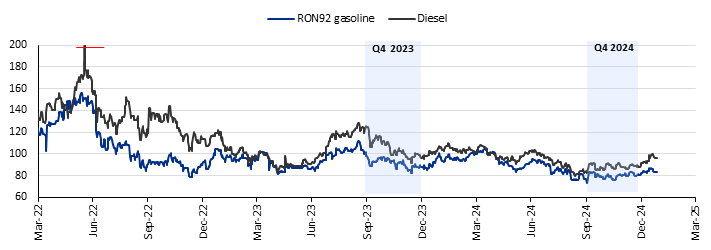
Source: Ministry of Industry and Trade, Vietcap (Data as of January 25, 2025)
Figure 3: Vietnamese E5 gasoline and diesel retail prices, including the impact of the petroleum stabilization fund (VND/liter)
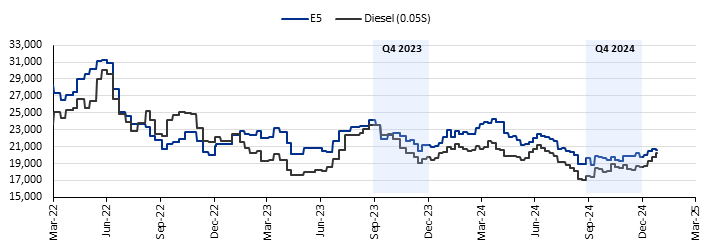
Source: PLX, Vietcap (Data as of January 25, 2025)
Powered by Froala Editor